Seawater desalination has really changed over the last ten years, both in technology and cost. Today, modern seawater reverse osmosis (SWRO) systems, especially those with energy recovery, can make fresh water for just $0.40-$0.80 per cubic meter in big plants. That’s competitive with traditional water treatment methods in places where water is scarce. This guide will walk you through how SWRO works, what makes energy and capital costs different between systems, how to think about getting rid of brine, and what’s next for desalination technology as we head into 2026 and beyond.
- Globally, we now have over 100 million m-/day of desalination capacity, as of 2023.
- SWRO, or seawater reverse osmosis, makes up more than 60% of all desalination capacity worldwide.
- Since the 1990s, energy recovery devices have cut SWRO energy use by up to 60%.
- The Middle East and North Africa run the most desalination capacity globally.
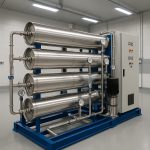
- AMPAC USA SWRO systems handle capacities from 1,800 to over 100,000 GPD for commercial and industrial needs.
that by 2025, half the world’s people would live in water-stressed areas. The International Desalination Association reports that global desalination capacity topped 100 million cubic meters per day in 2023, a big jump from 65 million in 2015. SWRO now accounts for roughly 70% of all global desalination capacity.
- Intake screening: Bar screens and fine screens pull out marine life, trash, and big particles from raw seawater.
- Pre-treatment: Dissolved air flotation (DAF) or multimedia filtration cuts down on algae, suspended solids, and cloudiness. Sometimes, coagulation-flocculation is added for surface seawater intakes.
- Cartridge filtration (5-micron): This is the final particle protection before the high-pressure pump.
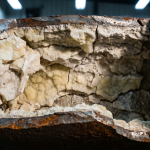
- Antiscalant dosing: Stops sulfate and carbonate from scaling up the membranes.
- High-pressure pump + energy recovery device: This pressurizes the feed to 800-1,200 psi, and the ERD gets pressure back from the brine stream.
- SWRO membrane array: Multi-stage pressure vessel arrays hit 40-50% recovery, meaning 40-50 gallons of clean water for every 100 gallons of feed.
- Post-treatment: Things like remineralization (using lime or calcite contactors), pH adjustment, disinfection, and fluoride dosing happen here before the water goes out for distribution.
- Intake screening: Bar screens and fine screens pull out marine life, trash, and big particles from raw seawater.
- Pre-treatment: Dissolved air flotation (DAF) or multimedia filtration cuts down on algae, suspended solids, and cloudiness. Sometimes, coagulation-flocculation is added for surface seawater intakes.
- Cartridge filtration (5-micron): This is the final particle protection before the high-pressure pump.
- Antiscalant dosing: Stops sulfate and carbonate from scaling up the membranes.
- High-pressure pump + energy recovery device: This pressurizes the feed to 800-1,200 psi, and the ERD gets pressure back from the brine stream.
- SWRO membrane array: Multi-stage pressure vessel arrays hit 40-50% recovery, meaning 40-50 gallons of clean water for every 100 gallons of feed.
- Post-treatment: Things like remineralization (using lime or calcite contactors), pH adjustment, disinfection, and fluoride dosing happen here before the water goes out for distribution.
| System Type | Energy Consumption (kWh/m-) | Relative Cost Index |
|---|---|---|
| Early SWRO (no ERD, pre-2000) | 7-12 | 3.0x |
| Modern SWRO (centrifugal ERD) | 4-6 | 1.8x |
| Modern SWRO (isobaric ERD) | 2.5-4.0 | 1.0x (baseline) |
| Brackish water RO (no ERD) | 0.5-1.5 | 0.4x |
If electricity costs $0.08/kWh, the energy part of making 1 cubic meter of desalinated water with a modern SWRO system and ERD is about $0.24-$0.32. That’s less than half the cost of seawater RO back in the 1990s. This is why cities like Dubai, Singapore, Tel Aviv, and Los Angeles now count on SWRO as a main water source, not just a last resort.
says that over 90% of new desalination capacity signed between 2020-2024 used membrane technology.
The EPA’s Marine Protection, Research, and Sanctuaries Act controls ocean discharge in US waters, and the WHO’s desalination guidelines cover both brine management and the remineralization needed for permeate that’s too pure to go straight into distribution.
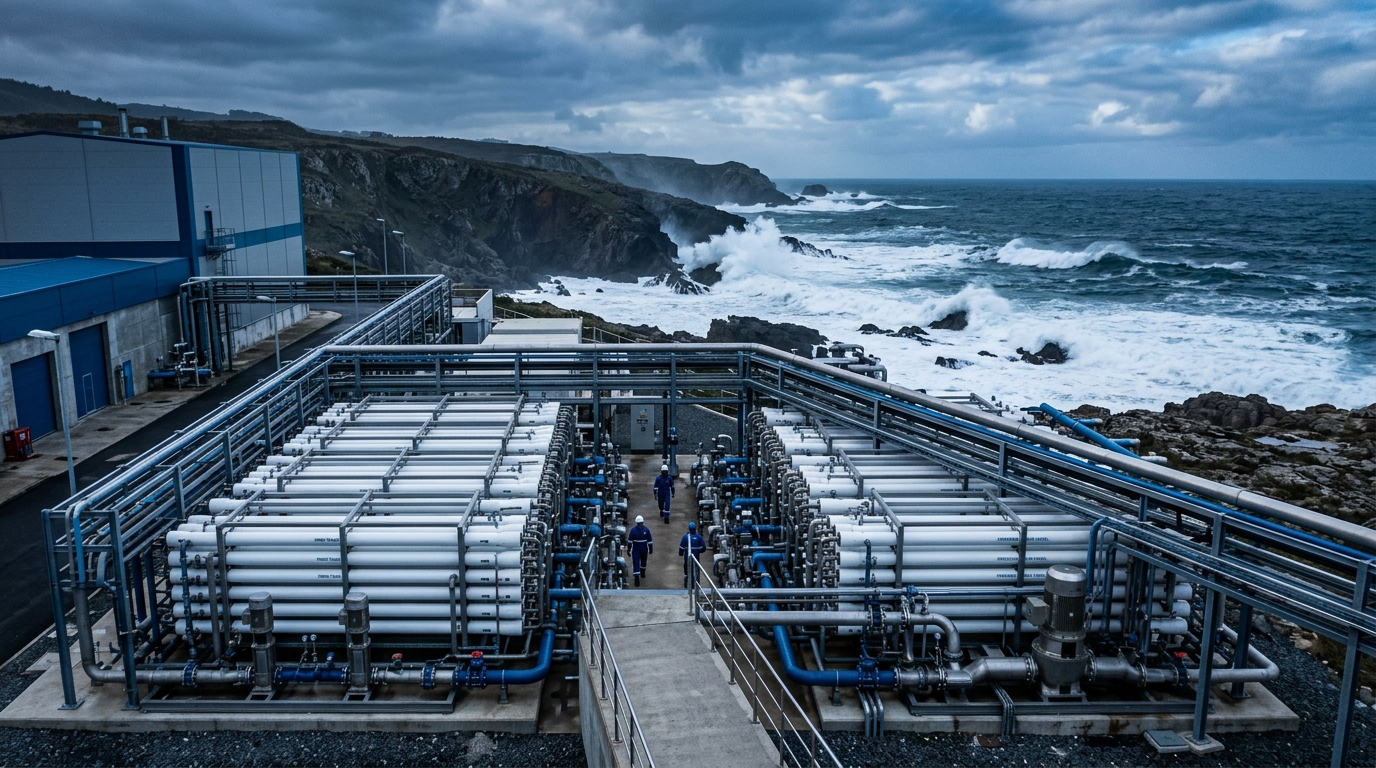
Big municipal SWRO plants, from 1 MGD to over 100 MGD, serve coastal cities where freshwater is scarce or droughts have made traditional supplies insufficient. The Claude Buss Desalination Plant in Carlsbad, CA, at 50 MGD, was the largest in the US when it opened and now provides about 10% of San Diego County’s water. Singapore gets 30% of its national water from SWRO. Israel produces over 80% of its municipal water through desalination.
seawater desalination systems specifically for these kinds of places.
Modern cruise ships carry SWRO systems that make 100,000-500,000 GPD to supply 3,000-6,000 passengers and crew. Naval vessels depend on compact, high-pressure SWRO for drinking water at sea. The U.S. Navy and allied naval forces trust AMPAC USA systems for their shipboard freshwater needs.
The cost to build solar photovoltaic electricity has dropped 90% since 2010. Now, solar-powered SWRO plants are running in Saudi Arabia, Chile, and Australia, producing water at costs that compete with grid-powered systems in sunny regions. Battery storage or grid backup handles when the sun isn’t shining. Solar-powered desalination is one of the fastest-growing parts of the industry.
Seawater brine holds lithium, magnesium, potassium, bromine, and uranium in amounts that could be commercially valuable. Extracting specific ions from desalination brine is moving from research to commercial use, with lithium recovery from SWRO brine being tested in Chile, Israel, and the UAE. Could brine actually become a resource? It might just help offset desalination operating costs.
seawater desalination systems
When specifying a SWRO system, the critical design inputs are:
- Seawater TDS and temperature: Both affect osmotic pressure and required operating pressure; feed water temperature below 15-C significantly reduces membrane permeability
- Biological fouling potential: Coastal waters near estuaries, algae bloom zones, or harbors require more robust pre-treatment
- Required permeate quality: Potable water standards require post-treatment remineralization; process water may require additional polishing
- Recovery rate target: Higher recovery reduces brine volume but increases scaling risk and concentrate salinity
- Energy source and cost: Solar, grid, diesel genset, or co-generation all affect operating cost differently
- Intake design: Open ocean intakes vs. beach wells (which provide natural pre-filtration) significantly affect pre-treatment requirements and biological fouling risk
composition of seawater and .
Capital costs range from approximately $3,000-$8,000 per daily cubic meter of capacity for large municipal plants to $15,000-$30,000 per daily cubic meter for small packaged systems. A 1 MGD (3,785 m-/day) municipal SWRO plant typically costs $8-$18 million installed. Operating costs in modern plants with energy recovery range from $0.40-$0.80 per cubic meter – roughly $1.50-$3.00 per 1,000 gallons. Small packaged systems and those using diesel power are significantly more expensive per unit output.
Typical SWRO recovery rates are 40-50% – meaning 40-50 gallons of fresh water are produced per 100 gallons of seawater intake. Higher recovery increases scaling risk and concentrate salinity. Some advanced SWRO systems use second-pass concentrate treatment or high-recovery brackish RO stages on the brine stream to push overall recovery above 60%, but this requires more complex engineering and energy management.
The primary differences are feed water salinity and operating pressure. SWRO handles seawater at 33,000-37,000 ppm TDS and requires 800-1,200 psi operating pressure. Brackish water RO handles water at 1,000-10,000 ppm TDS and operates at 150-400 psi – requiring significantly less energy (0.5-1.5 kWh/m- vs. 2.5-4.0 kWh/m- for SWRO with ERD). The membrane types, pump specifications, and pressure vessel ratings are different between the two system types.
World Health Organization. Desalination for Safe Water Supply: Guidance for the Health and Environmental Aspects Applicable to Desalination. WHO. who.int
International Desalination Association. IDA Desalination Yearbook 2024-2025. IDA.
U.S. EPA. Marine Protection, Research, and Sanctuaries Act. EPA.
Water Research Foundation. Seawater Desalination Costs. WRF.
American Membrane Technology Association. AMTA Membrane Technology Fact Sheets. AMTA.
NSF International. NSF/ANSI Standard 58: Reverse Osmosis Drinking Water Treatment Systems. NSF.
Conclusion
This post highlighted how emergency and military-grade water purification systems provide safe drinking water rapidly in the most challenging field conditions. For organizations requiring deployable water treatment capability, AMPAC USA engineers portable and trailer-mounted systems built to perform wherever they are needed. Contact our team at info@ampac1.com or (909) 548-4900 to discuss your emergency water treatment requirements.
Need a Water Treatment Solution?AMPAC USA engineers custom water purification systems for commercial, industrial, and emergency applications — from 500 GPD to multi-million GPD. Trusted by municipalities, military, and industry worldwide.
Capital costs range from approximately $3,000-$8,000 per daily cubic meter of capacity for large municipal plants to $15,000-$30,000 per daily cubic meter for small packaged systems. A 1 MGD (3,785 m-/day) municipal SWRO plant typically costs $8-$18 million installed. Operating costs in modern plants with energy recovery range from $0.40-$0.80 per cubic meter – roughly $1.50-$3.00 per 1,000 gallons. Small packaged systems and those using diesel power are significantly more expensive per unit output.
Typical SWRO recovery rates are 40-50% – meaning 40-50 gallons of fresh water are produced per 100 gallons of seawater intake. Higher recovery increases scaling risk and concentrate salinity. Some advanced SWRO systems use second-pass concentrate treatment or high-recovery brackish RO stages on the brine stream to push overall recovery above 60%, but this requires more complex engineering and energy management.
The primary differences are feed water salinity and operating pressure. SWRO handles seawater at 33,000-37,000 ppm TDS and requires 800-1,200 psi operating pressure. Brackish water RO handles water at 1,000-10,000 ppm TDS and operates at 150-400 psi – requiring significantly less energy (0.5-1.5 kWh/m- vs. 2.5-4.0 kWh/m- for SWRO with ERD). The membrane types, pump specifications, and pressure vessel ratings are different between the two system types.
Conclusion
This post highlighted how emergency and military-grade water purification systems provide safe drinking water rapidly in the most challenging field conditions. For organizations requiring deployable water treatment capability, AMPAC USA engineers portable and trailer-mounted systems built to perform wherever they are needed. Contact our team at info@ampac1.com or (909) 548-4900 to discuss your emergency water treatment requirements.
AMPAC USA engineers custom water purification systems for commercial, industrial, and emergency applications — from 500 GPD to multi-million GPD. Trusted by municipalities, military, and industry worldwide.