The U.S. Food and Drug Administration (FDA) has several rules about water in food and beverage manufacturing. You need to understand these rules to stay compliant, pass audits, and keep your customers safe.
21 CFR 129: Processing and Bottling of Bottled Drinking Water
FDA 21 CFR Part 129 sets the current Good Manufacturing Practice (cGMP) rules for processing and bottling drinking water. This applies to any facility that processes water meant for people to drink as a packaged product. What does it cover? Things like protecting and monitoring source water, making sure your treatment processes work, testing for microbes (total coliform, E. coli, and heterotrophic plate count), chemical contaminant limits that match EPA drinking water rules, and keeping your facility and equipment clean.
Under 21 CFR 129.35, both your product water and operations water must come from an approved source and meet the quality standards in 21 CFR 165.110. This means even if your city water meets EPA standards when it arrives, your facility is still responsible for making sure it meets those standards where you actually use it in production.
21 CFR 110: Current Good Manufacturing Practice for Food
FDA 21 CFR Part 110 (which is mostly rolled into 21 CFR Part 117 under FSMA now) lays out general cGMP requirements for all food manufacturing facilities. Section 110.37 specifically talks about water. It says that water for food manufacturing must be safe and clean, water that touches food or food-contact surfaces must meet EPA drinking water standards, and steam used directly with food must be contaminant-free. These rules apply to water you use as an ingredient, for washing food, for cleaning surfaces and equipment, and for cooling and heating.
HACCP, or Hazard Analysis and Critical Control Points, is a systematic way to prevent food safety issues. It’s required for juice, seafood, and meat processors, and most other food and beverage manufacturers use it too. Water quality is a core part of every HACCP plan.
The HACCP framework also calls for prerequisite programs to support CCP management. For water quality, these usually include annual comprehensive water testing by a certified lab, monthly or quarterly on-site testing for key factors, schedules for water treatment system maintenance, testing backflow prevention devices, and inspecting and cleaning water storage tanks. Both the International Association for Food Protection (IAFP) and the Global Food Safety Initiative (GFSI) stress that water quality prerequisite programs must be written down, kept up-to-date, and ready for an auditor to review.
| F&B Sector | Max TDS (ppm) | Max Turbidity (NTU) | Chlorine Limit | pH Range | Key Concerns |
|---|---|---|---|---|---|
| Soft Drink / Carbonated Beverage | <10 | <0.5 | 0 ppm (must be removed) | 6.5-7.0 | Flavor consistency, CO2 interaction, alkalinity |
| Brewing (Beer) | <50 | <1.0 | 0 ppm | 5.2-9.5 (varies by style) | Mineral profile affects flavor; chlorine creates chlorophenols |
| Dairy Processing | <200 | <1.0 | <0.5 ppm | 6.5-7.5 | Microbiological safety, CIP water quality |
| Bakery / Dough Production | <300 | <5.0 | <2.0 ppm | 6.0-8.0 | Mineral content affects gluten development and yeast activity |
| Bottled Water | Per label claim | <0.5 | 0 ppm | 6.5-8.5 | Consistency, taste, 21 CFR 165.110 compliance |
| Juice / Non-Carbonated Beverage | <50 | <1.0 | 0 ppm | Product-specific | Flavor neutrality, microbial safety |
| Pharmaceutical (USP Purified) | <1 | N/A | 0 ppm | 5.0-7.0 | USP <1231 compliance, endotoxin control, conductivity |
| Confectionery / Candy | <100 | <1.0 | <0.5 ppm | 6.5-7.5 | Sugar crystallization, flavor purity |
| Meat / Poultry Processing | EPA potable std | <1.0 | Residual required | 6.5-8.5 | USDA-FSIS requirements, pathogen control in wash water |
| Infant Formula | <50 | <0.5 | 0 ppm | 6.5-7.5 | Nitrate <10 ppm, heavy metals near zero, strictest standards |
Key Takeaway: Soft drink companies, brewers, pharmaceutical makers, and infant formula manufacturers need the absolute purest water. Reverse osmosis systems that get TDS below 10 ppm with no chlorine provide the basic water quality these sectors demand. Then, manufacturers can carefully add back specific minerals (like calcium chloride or gypsum for brewing) to get their perfect water profile.
Commercial RO membranes block 95-99% of dissolved solids, over 99% of bacteria and viruses, 96-99% of heavy metals (like lead, arsenic, cadmium, mercury), 99% of pesticides and herbicides, and 90-99% of pharmaceutical residues. This wide-ranging ability means one RO system can handle many water quality needs at once. That simplifies your treatment process and means you don’t need a bunch of different treatment technologies.
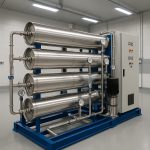
Commercial RO systems are inherently modular. AMPAC USA designs commercial RO systems that can be configured from 1,000 GPD for small artisan producers up to 500,000+ GPD for large-scale manufacturing operations. Modular design means you can start with capacity matched to current production and add membrane elements or parallel trains as production grows, without replacing the entire system.
Proper system sizing is critical for F&B applications. An undersized system creates production bottlenecks and forces the system to operate at maximum capacity continuously, reducing membrane life. An oversized system wastes capital and may develop biological growth during periods of low demand. The following methodology helps determine the right system capacity for your facility.
Not all water streams in your facility require the same quality level. Ingredient water typically requires the highest quality (lowest TDS, zero chlorine, microbial safety). CIP final rinse water should match ingredient water quality. CIP pre-rinse water can use lower-quality water. Boiler feed water requires low TDS to prevent scaling but does not need to be potable-grade. Segregating water quality requirements by use allows you to optimize system design and reduce treatment costs.
| Facility Size / Production Volume | Recommended RO Capacity (GPD) | Recovery Rate | Typical System Configuration |
|---|---|---|---|
| Small artisan / craft (under 1,000 gal/day product) | 3,000-5,000 | 50-65% | Single-stage, single membrane vessel |
| Mid-size producer (1,000-5,000 gal/day product) | 10,000-25,000 | 65-75% | Multi-stage with concentrate recirculation |
| Large producer (5,000-20,000 gal/day product) | 25,000-100,000 | 75-85% | Multi-train with redundancy, PLC controls |
| Industrial scale (20,000+ gal/day product) | 100,000-500,000+ | 80-90% | Multi-train, energy recovery, full automation |
Always size the system 20-30% above calculated peak demand to account for membrane aging, seasonal source water variation, and unexpected production increases. This design margin ensures your facility never faces water supply constraints during peak production periods.
Parameter
Monitoring Method
Frequency
Purpose
TDS / Conductivity
Inline conductivity meter
Continuous
Confirms RO membrane performance; triggers alarm if rejection drops
pH
Inline pH sensor
Continuous
Product consistency; corrosion control; CIP effectiveness
Chlorine (free/total)
Amperometric or colorimetric sensor
Continuous
Protects RO membranes; confirms removal for beverage production
Turbidity
Inline turbidimeter
Continuous
Pre-filter performance; membrane protection
Flow rate
Flow meter (permeate and concentrate)
Continuous
Recovery rate monitoring; production capacity verification
Pressure
Pressure transducers
Continuous
Membrane fouling detection; pump performance
Temperature
RTD or thermocouple
Continuous
Normalizes flux calculations; seasonal adjustment
| Parameter | Monitoring Method | Frequency | Purpose |
|---|---|---|---|
| TDS / Conductivity | Inline conductivity meter | Continuous | Confirms RO membrane performance; triggers alarm if rejection drops |
| pH | Inline pH sensor | Continuous | Product consistency; corrosion control; CIP effectiveness |
| Chlorine (free/total) | Amperometric or colorimetric sensor | Continuous | Protects RO membranes; confirms removal for beverage production |
| Turbidity | Inline turbidimeter | Continuous | Pre-filter performance; membrane protection |
| Flow rate | Flow meter (permeate and concentrate) | Continuous | Recovery rate monitoring; production capacity verification |
| Pressure | Pressure transducers | Continuous | Membrane fouling detection; pump performance |
| Temperature | RTD or thermocouple | Continuous | Normalizes flux calculations; seasonal adjustment |
| Test | Frequency | Method / Standard | Purpose |
|---|---|---|---|
| Total coliform / E. coli | Weekly minimum | EPA Method 9223B (Colilert) | Microbial safety verification |
| Heterotrophic plate count | Monthly | Standard Method 9215 | General microbial quality; biofilm indicator |
| Full mineral panel | Quarterly | EPA 200.7 (ICP-OES) | Comprehensive water chemistry profile |
| Heavy metals (Pb, As, Cd, Hg) | Quarterly | EPA 200.8 (ICP-MS) | Regulatory compliance; safety verification |
| Pesticide / herbicide screen | Semi-annually | EPA 525.2 / 515.3 | Agricultural contamination check |
| VOCs | Semi-annually | EPA 524.2 | Industrial contamination screening |
| Endotoxin (pharmaceutical only) | Per batch | USP <85 LAL | Pyrogen control for pharmaceutical water systems |
A regional beverage manufacturer producing flavored water, sports drinks, and carbonated beverages at a volume of 8,000 gallons of finished product per day. The facility uses municipal water with a TDS of 420 ppm, hardness of 280 ppm as CaCO3, chlorine residual of 1.5 ppm, and seasonal turbidity spikes up to 3 NTU during spring runoff. Production quality requirements specify less than 10 ppm TDS for carbonated products, less than 50 ppm TDS for non-carbonated products, zero chlorine in all product water, and turbidity below 0.5 NTU at all times.
Metric
Before RO Installation
After RO Installation
Improvement
Product water TDS
420 ppm (municipal supply)
8-12 ppm (RO permeate)
97-98% reduction
Chlorine in product water
0.8-1.5 ppm
Non-detect
100% removal
Product taste consistency
Seasonal variation complaints
Consistent year-round
Eliminated variation
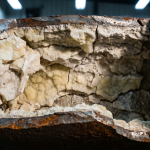
Boiler descaling frequency
Quarterly
Annually
75% reduction in maintenance
FDA audit water findings
2 observations (previous audit)
0 observations
Full compliance
Water cost per 1,000 gallons
$2.10 (municipal only)
$3.85 (municipal + RO treatment)
Increased by $1.75
Product rejection rate
1.8% (taste/quality)
0.3%
83% reduction in waste
Annual net savings
Baseline
$47,000/year
ROI achieved in 14 months
| Metric | Before RO Installation | After RO Installation | Improvement |
|---|---|---|---|
| Product water TDS | 420 ppm (municipal supply) | 8-12 ppm (RO permeate) | 97-98% reduction |
| Chlorine in product water | 0.8-1.5 ppm | Non-detect | 100% removal |
| Product taste consistency | Seasonal variation complaints | Consistent year-round | Eliminated variation |
| Boiler descaling frequency | Quarterly | Annually | 75% reduction in maintenance |
| FDA audit water findings | 2 observations (previous audit) | 0 observations | Full compliance |
| Water cost per 1,000 gallons | $2.10 (municipal only) | $3.85 (municipal + RO treatment) | Increased by $1.75 |
| Product rejection rate | 1.8% (taste/quality) | 0.3% | 83% reduction in waste |
| Annual net savings | Baseline | $47,000/year | ROI achieved in 14 months |
The increased water treatment cost of $1.75 per 1,000 gallons was more than offset by reduced product waste, lower equipment maintenance costs, and elimination of FDA audit findings. The system achieved a full return on investment within 14 months of installation.
Municipal water supplies and well water sources experience significant seasonal variation in TDS, turbidity, organic content, and microbial load. Spring snowmelt can double turbidity levels. Summer algal blooms introduce taste and odor compounds. Agricultural runoff seasonally elevates nitrate levels. An RO system with robust pretreatment absorbs these variations and produces consistent output quality, but the system must be designed to handle worst-case source water conditions, not just average values.
An increasing number of municipal water systems are switching from chlorine to chloramine (chloramine is a combination of chlorine and ammonia) as a secondary disinfectant. Chloramine is more persistent than chlorine and is not effectively removed by standard granular activated carbon (GAC) filters. Catalytic carbon filters or significantly larger GAC beds with extended contact times are required for chloramine removal. This is particularly critical in brewing, where chloramine creates chlorophenol off-flavors at concentrations as low as 1-2 parts per billion.
| Maintenance Task | Frequency | Documentation Required |
|---|---|---|
| Pre-filter cartridge replacement | Monthly or by differential pressure | Date, filter type, pressure readings before/after |
| Carbon filter media replacement or regeneration | Per manufacturer schedule (typically 6-12 months) | Date, media type, chlorine breakthrough test results |
| RO membrane cleaning (CIP) | Quarterly or when normalized permeate flow drops 10-15% | Date, cleaning chemicals used, flux before/after |
| RO membrane replacement | Every 2-5 years depending on feed water quality | Date, membrane model, rejection test results |
| Instrument calibration (pH, conductivity, flow) | Monthly | Calibration standards used, before/after readings |
| Storage tank inspection and sanitation | Quarterly | Visual inspection notes, sanitation method, microbial test results |
| UV lamp replacement | Annually or at 9,000 hours | Date, lamp model, UV intensity reading before/after |
| System performance review | Monthly | Trending report: TDS, flow, pressure, recovery, temperature |