
Sensor-based predictive maintenance – tracking normalized permeate flow, pressure differential, and pump vibration trends instead of waiting for a failure or a fixed calendar date – is measurably cutting unplanned downtime at water treatment facilities. Vendor-reported deployments show reductions in unplanned failures and emergency callouts in the 25-70% range depending on scope, and the underlying signals (flow, pressure drop, vibration) are the same ones commercial and industrial RO operators can start trending today, with or without an AI platform.
What “Predictive Maintenance” Actually Means for an RO System
Most commercial and industrial water treatment programs run on one of two models: reactive maintenance (fix it when it breaks) or calendar-based maintenance (clean or replace on a fixed schedule, regardless of actual condition). Predictive maintenance replaces the calendar with a trend line. Instead of assuming a membrane needs cleaning every 90 days, the system – or the operator – watches how permeate flow, pressure drop, and pump vibration are actually moving over time, and flags a problem before output drops or a pump seizes.
For RO and water treatment equipment specifically, the three signals that carry the most diagnostic weight are normalized permeate flow, normalized pressure differential across the membrane array, and vibration or motor current on high-pressure pumps. None of these are new measurements – RO operators have logged flow and pressure by hand for decades. What predictive maintenance changes is the discipline of trending them against a baseline and setting alert thresholds, rather than just recording a number and moving on.
The Three Signals Worth Watching
Normalized Permeate Flow
Raw permeate flow swings with feed temperature and pressure, so a drop in gallons-per-day on its own does not tell you whether a membrane is fouling. Normalized permeate flow (NPF) corrects the measured flow back to reference temperature and pressure conditions (the ASTM D4516 method most manufacturers reference), which isolates the change that is actually caused by the membrane. As a practical threshold, a sustained drop of roughly 10-15% in NPF from a clean baseline is a widely used trigger point for scheduling a CIP cleaning before output becomes a problem – see AMPAC’s industrial RO troubleshooting guide for the full diagnostic sequence when NPF drops.
Normalized Pressure Differential
Differential pressure – the pressure drop from the front to the back of a membrane array – is one of the earliest indicators of feed-spacer fouling, and it typically moves before flow or rejection does. Academic work on RO performance monitoring treats pressure-drop trending as a leading indicator precisely because it responds to particulate and biological buildup on the feed spacers faster than flow decline does. Watching this number against a rolling baseline, rather than only reacting once a high-differential-pressure alarm trips, is what turns a pressure gauge into a predictive tool.
Pump Vibration and Motor Current
High-pressure feed pumps fail in patterns that show up in vibration and current signatures well before a bearing seizes or a seal lets go. A vendor case study published by predictive-maintenance provider iFactory AI, describing a deployment across 42 municipal pump stations, reported catching mechanical seal degradation 14-18 days ahead of failure and motor winding breakdown 3-4 weeks ahead of failure by trending bearing temperature, casing vibration, and motor current signatures together (iFactory AI, June 2026). The same principle applies to RO high-pressure pumps: vibration and current trends give operators days to weeks of warning that a calendar-based PM schedule cannot.
What the Real-World Numbers Actually Show
Reported results vary widely by scope and vendor, and facility managers evaluating this space should treat any single headline number with caution. Three sources with named, verifiable data give a useful range:
- Maintenance cost reductions exceeding 25% from AI-driven predictive maintenance adoption at water treatment facilities, per industry reporting in Water Online, “How AI-Powered Predictive Maintenance Is Reducing Downtime In Water Treatment Plants” (August 2026), which also lists differential pressure, vibration, motor current, and flow rate among the parameters utilities are trending.
- 55% reduction in unplanned pump station failures and 70% fewer after-hours emergency callouts in the first year of a predictive-maintenance rollout across 42 pump stations serving a 200,000-resident water system, with an estimated $340,000 in annual maintenance savings – a vendor-reported case study, not an independent audit, published by iFactory AI (June 2026).
- 92% correlation accuracy (R² = 0.921) for an artificial neural network model predicting transmembrane pressure at a seawater desalination plant, using feed temperature, turbidity, pH, conductivity, and flow as inputs – peer-reviewed research published in Eng (MDPI), “Prediction of Reverse Osmosis Membrane Fouling Using Machine Learning” (2026). This is early-stage research on model accuracy, not a deployed downtime-reduction figure, but it confirms that the same signals operators track manually (temperature, pH, conductivity, pressure) are the ones machine-learning models rely on too.
The pattern across all three sources is consistent even where the exact percentages differ: cost and downtime improvements come from acting on trend data days to weeks earlier than a reactive or calendar-based program would, not from any single algorithm doing something a human couldn’t eventually do with the same data.
Reactive, Calendar-Based, or Predictive: What Actually Changes
Reactive maintenance costs the most per incident because a failure usually takes production offline entirely and often damages adjacent equipment – a fouled membrane that’s ignored long enough can push differential pressure high enough to telescope or damage elements downstream. Calendar-based maintenance avoids the worst failures but wastes resources: membranes get cleaned or pumps get serviced on a fixed interval whether or not they need it, and a system that’s fouling faster than the schedule assumes still fails between service visits.
Predictive maintenance doesn’t require new equipment to start – it requires trending the data you’re already collecting. The difference between calendar-based and predictive maintenance is entirely about whether the maintenance trigger is a date on a calendar or a threshold crossed in a trend line. For a deeper walkthrough of service intervals and what to check at each one, see AMPAC’s RO system maintenance guide.
None of this is a new idea in industrial maintenance generally – vibration analysis and condition monitoring have been standard practice in rotating-equipment-heavy industries like power generation and oil and gas for decades. What’s changed for water treatment specifically over the past couple of years is that the sensors, data logging, and cloud dashboards needed to do it cheaply are now standard features on mid-size commercial and industrial equipment, not just large municipal plants with dedicated reliability engineers. That’s the real shift facility managers should pay attention to: the barrier to entry for trend-based maintenance has dropped, whether or not a facility ever adopts a machine-learning layer on top of it.
You Don’t Need a Full AI Platform to Start
Full predictive-maintenance platforms with machine-learning failure models are built for large, multi-site utilities with data science budgets. Most commercial and industrial RO operators don’t need that to get most of the benefit. The core discipline – trend the signal, set a threshold, act before the threshold is crossed – works with a logbook and a spreadsheet:
- Log permeate flow, feed pressure, and feed temperature at every reading – not just flow alone – so you can normalize flow yourself using the ASTM D4516 formula (or the calculator most membrane manufacturers publish) instead of comparing raw numbers that swing with the weather.
- Chart differential pressure on a rolling basis rather than only checking it against a single high-pressure alarm setpoint. A steady upward trend over several weeks is the early warning; a sudden spike is often already too late for the cheapest fix.
- Track conductivity/TDS rejection alongside flow and pressure, not in isolation. A membrane can pass a flow check while rejection is quietly declining from an O-ring failure or membrane damage – the combination of signals catches what any single one misses.
- Set a documented action threshold before you need it – for example, “CIP clean when NPF drops 15% from baseline” or “inspect pump bearings when vibration exceeds X mm/s” – so the decision to act isn’t left to whoever happens to notice the gauge that week.
This is the same manual approach covered step-by-step in AMPAC’s RO system troubleshooting guide, which walks through the fast checks and normalized-flow calculations operators can run without any additional instrumentation.
Where Instrumentation and Automation Fit on AMPAC Systems
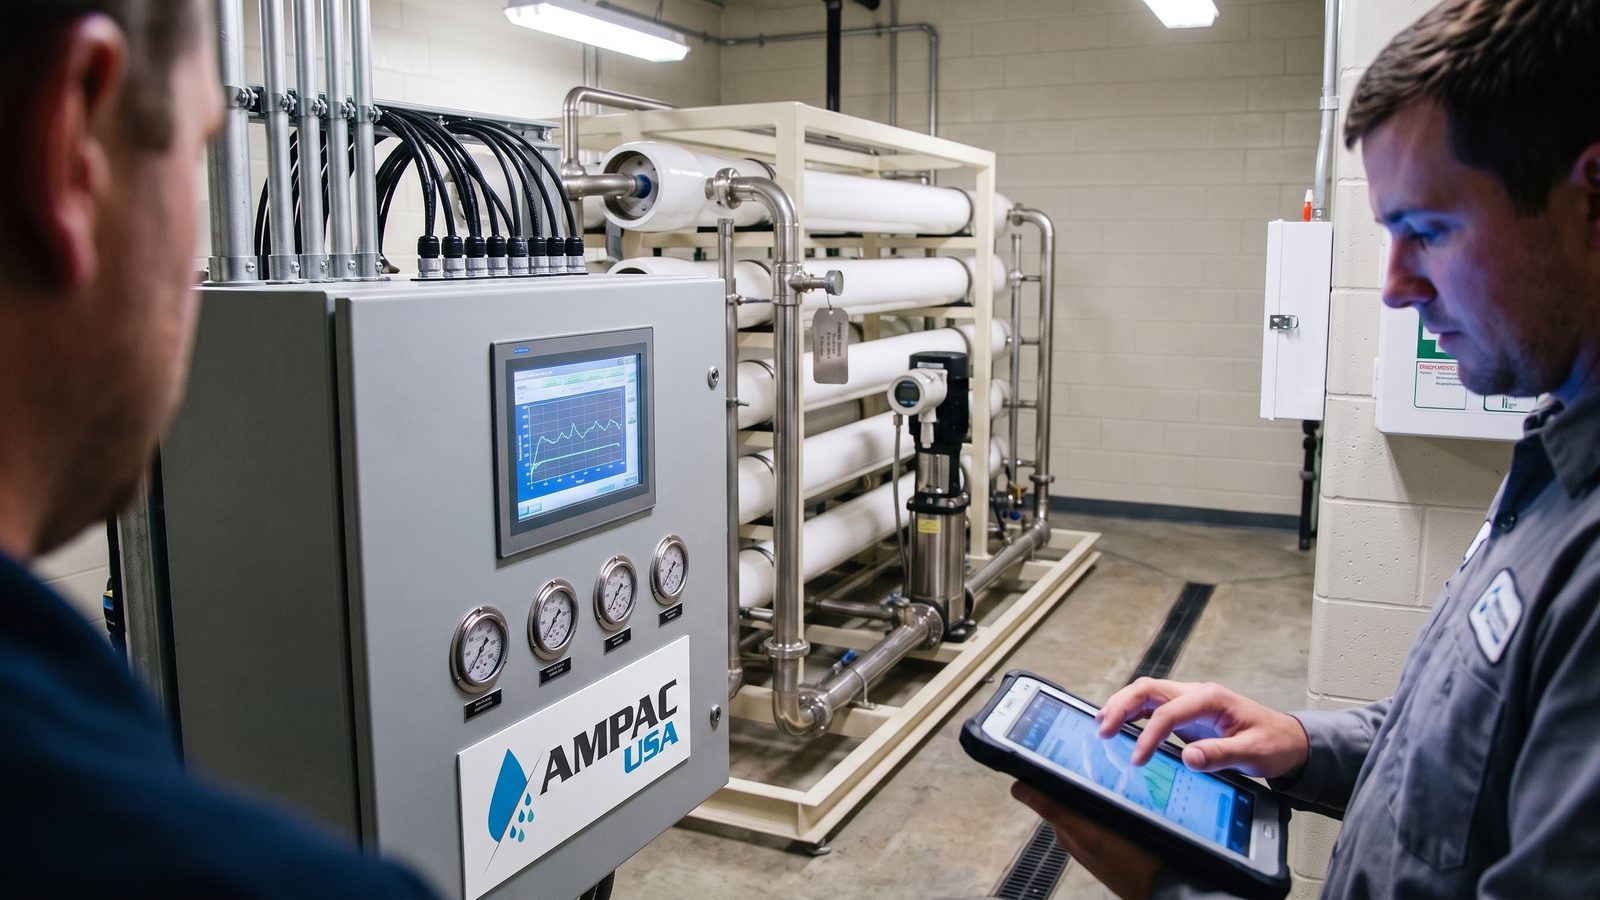
AMPAC’s commercial reverse osmosis systems and industrial reverse osmosis systems ship with PLC-based control and SCADA-ready outputs standard on larger units, including permeate and concentrate flow monitoring, automated pump sequencing, and data logging – the raw data layer that trend-based maintenance depends on. Larger industrial systems support SCADA integration via 4-20 mA outputs or Modbus TCP, so flow, pressure, and dosing data can already be pulled into a facility’s existing control or building-management system rather than read manually off a gauge. Whether that data gets trended in a spreadsheet, a facility SCADA historian, or a third-party predictive-maintenance platform, the instrumentation to capture it is already part of the system design – the maintenance program built on top of it is what determines whether downtime shows up as a scheduled cleaning or an unplanned outage.
Talk To AMPAC USA About Your RO System
Sizing a commercial or industrial RO system with SCADA-ready monitoring built in, or want help setting realistic trend thresholds for an existing system? AMPAC’s engineering team can walk through your feed water conditions, flow requirements, and control-integration needs.
Frequently Asked Questions
What is predictive maintenance for a reverse osmosis system?
Predictive maintenance means trending real operating data – normalized permeate flow, differential pressure across the membrane array, and pump vibration or motor current – against a baseline and acting when a threshold is crossed, instead of cleaning or servicing on a fixed calendar schedule regardless of actual condition.
Do I need AI or special software to do predictive maintenance on my RO system?
No. The core discipline – normalizing flow readings, charting pressure drop over time, and setting documented action thresholds – can be done with a logbook and a spreadsheet. AI and machine-learning platforms add automated anomaly detection at scale, which matters more for multi-site utilities than for a single commercial or industrial RO system.
How much can predictive maintenance actually reduce downtime in water treatment?
Reported results vary by scope. A vendor case study covering 42 municipal pump stations reported a 55% reduction in unplanned failures and 70% fewer emergency callouts in year one, while broader industry reporting cites maintenance cost reductions exceeding 25%. Results depend heavily on how reactive the prior maintenance program was.
What’s the earliest warning sign that an RO membrane is fouling?
A rising trend in normalized differential pressure across the membrane array typically shows up before normalized permeate flow or salt rejection change measurably, because pressure drop responds directly to feed-spacer fouling. A sustained 10-15% drop in normalized permeate flow from baseline is a common trigger point for scheduling a CIP cleaning.
Does my commercial RO system need special sensors to support predictive maintenance?
Not necessarily. Standard flow meters, pressure gauges, and a TDS/conductivity meter provide the core data. AMPAC’s commercial and industrial RO systems include PLC-based controls with data logging and SCADA-ready outputs on larger units, which makes it easier to pull that data automatically rather than reading gauges by hand.