
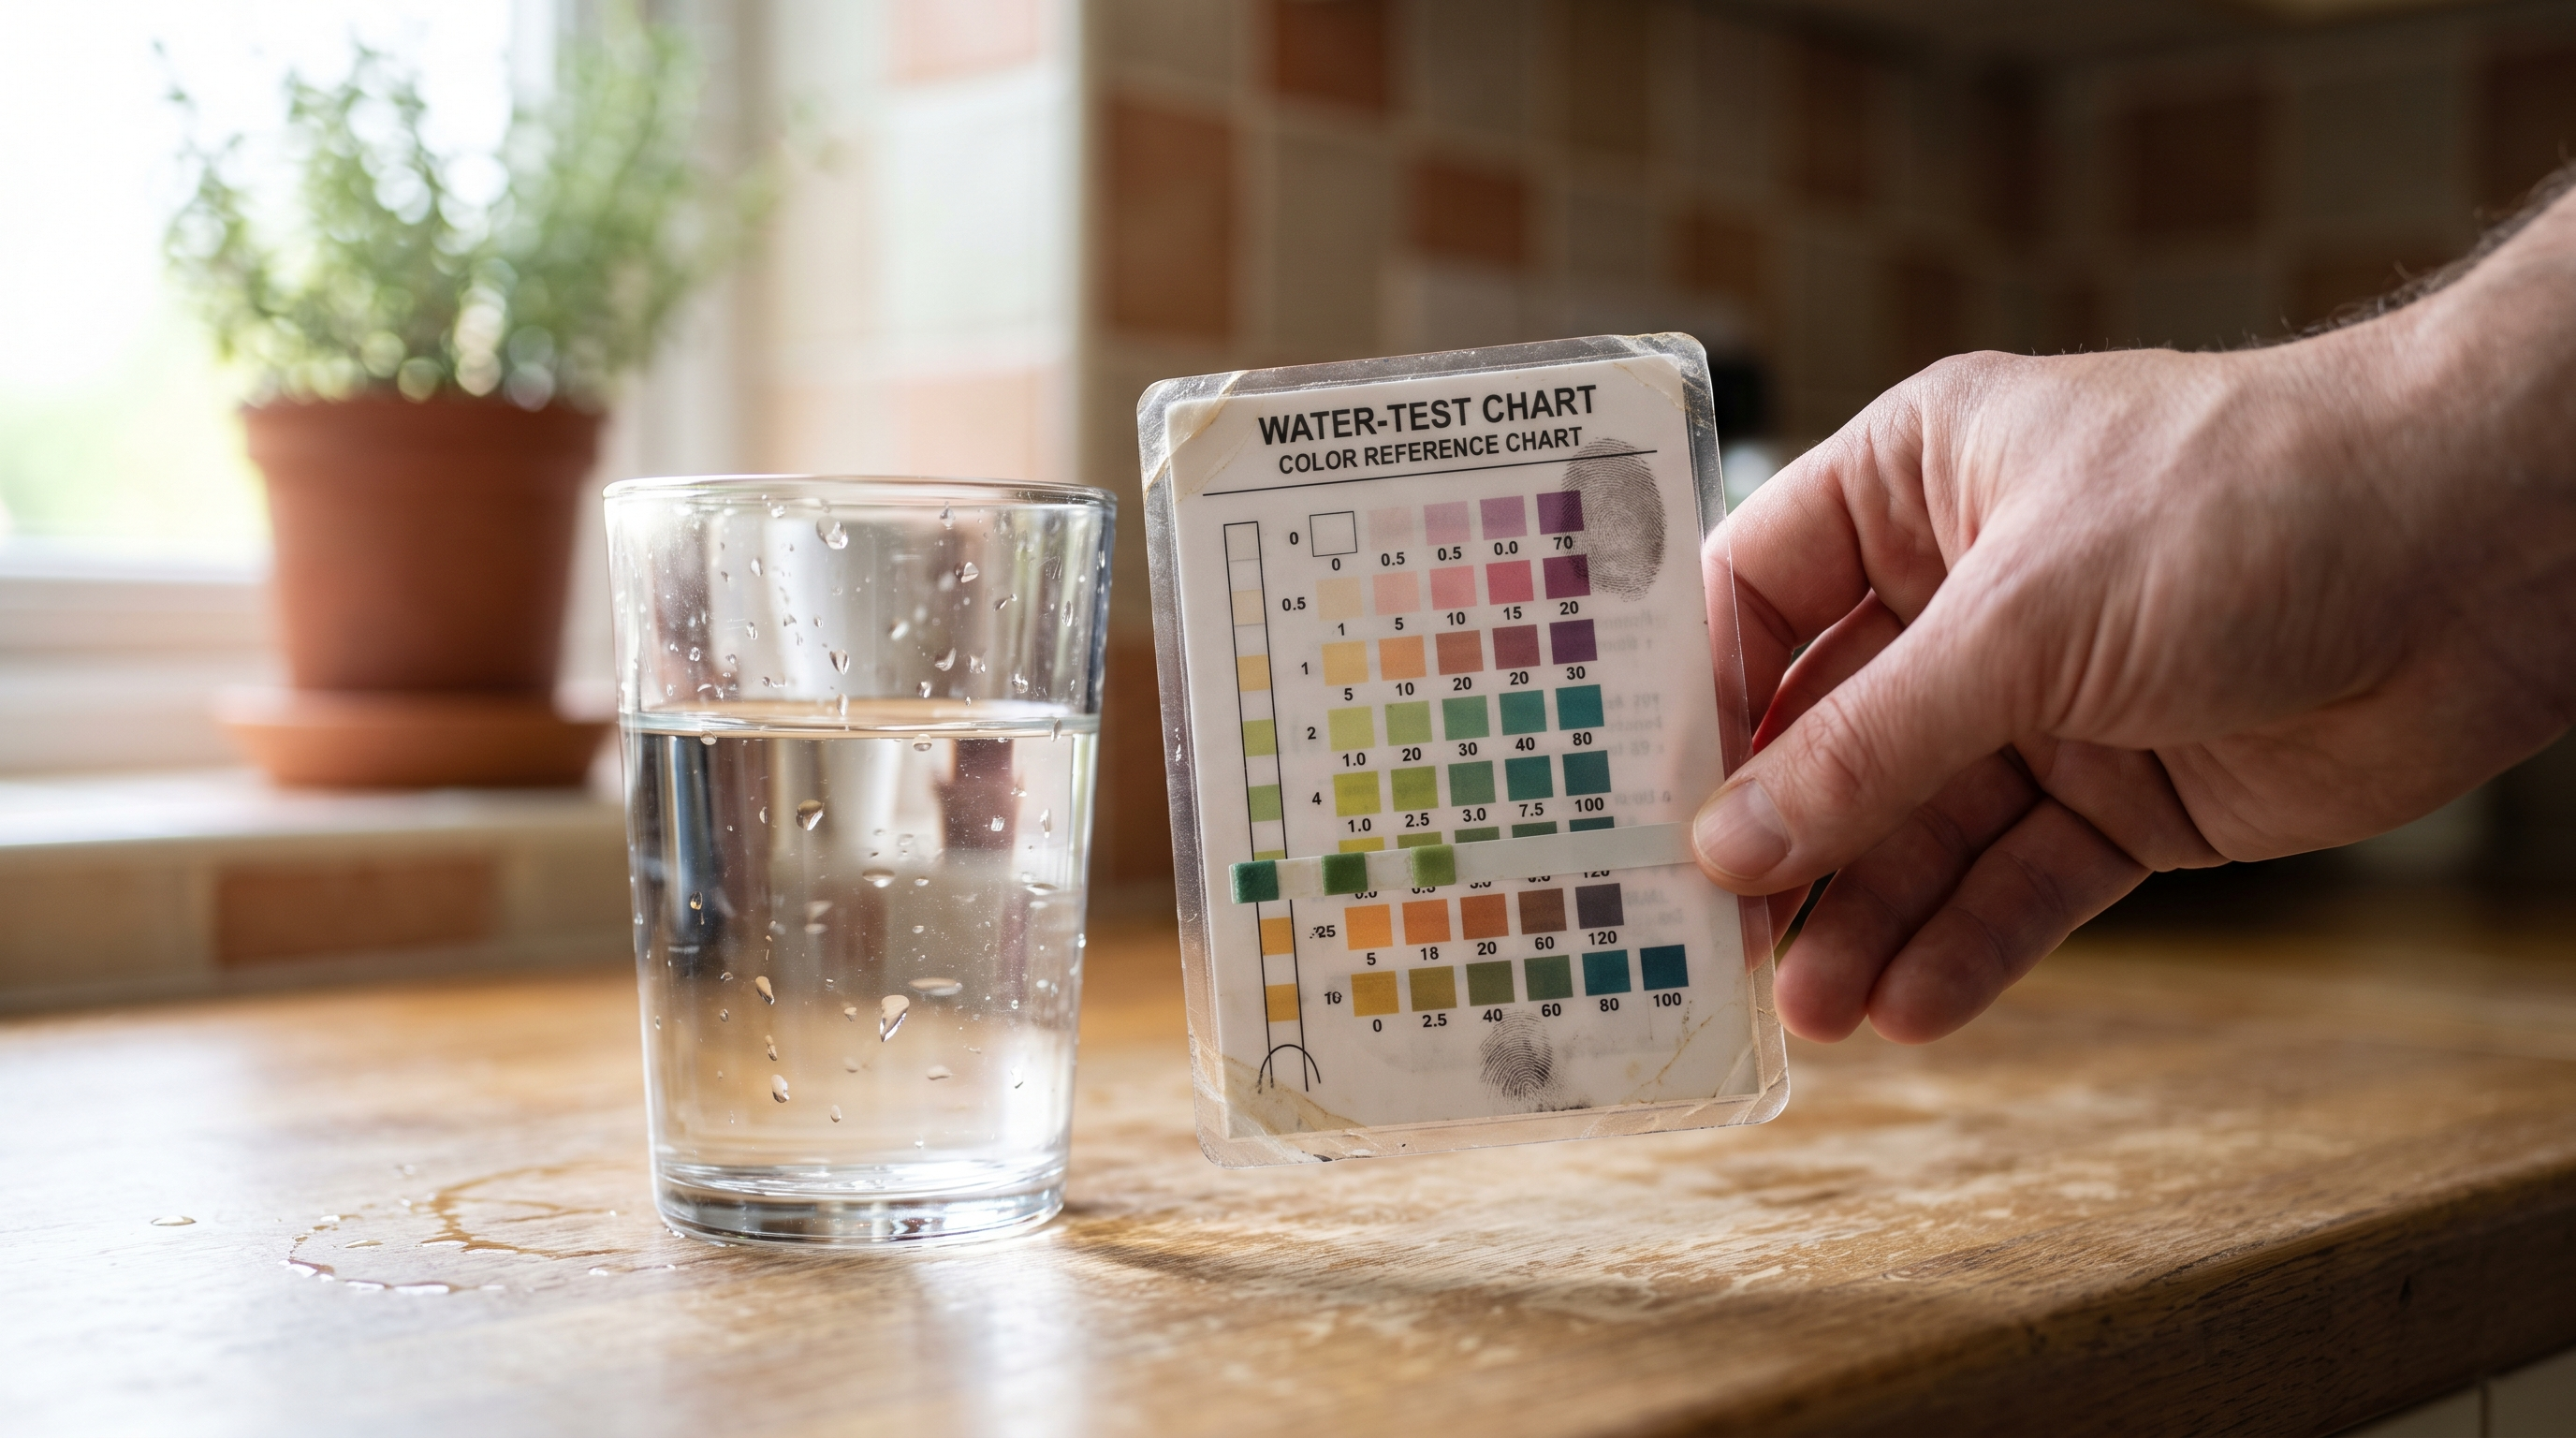
In short: national testing programs from USGS, the CDC, and the Environmental Working Group have found detectable heavy metals, including lead, arsenic, and hexavalent chromium (chromium-6), in tap water across every US state. EWG’s 2025 database update tracked 324 contaminants across roughly 50,000 water systems, and one interactive map from the group shows nearly 100 million Americans drinking water where chromium-6 shows up alongside arsenic and nitrate at the same time. None of this means the water coming out of your faucet is an emergency. It means the same reverse osmosis technology industrial plants have used for decades to strip metals out of process water now exists in a countertop and under-sink size, and it’s worth knowing how it works before you decide whether you need it.
Most of what gets written about tap water contamination reads like a warning label with no instructions. This one has instructions.
What Did the National Surveys Actually Find?
They found that heavy metal contamination in US tap water is widespread, low-level in most cases, and unevenly distributed depending on your water source, your pipes, and your local geology.
The Environmental Working Group’s Tap Water Database, last updated in early 2025 using EPA-reported data collected between 2021 and 2023, is the most complete public picture available. It pulled results from nearly 50,000 community water systems and turned up 324 separate contaminants nationwide, most systems included. Arsenic alone was detected in utilities serving about 134 million people across all 50 states. Chromium-6, the carcinogen that became famous through the Erin Brockovich case in Hinkley, California, turned up in water serving more than 250 million Americans, and there’s still no federal limit for it specifically. A follow-up EWG mapping project found nearly 100 million people are served by utilities where chromium-6 shows up in the same water as arsenic and nitrate, a combination the group’s own peer-reviewed research estimates could account for up to 50,000 cancer cases over a lifetime of exposure if left untreated.
Separately, USGS and CDC researchers looked specifically at private wells, which aren’t covered by EPA’s public water system rules at all. Their national-scale study found an estimated 2.7 million people are potentially exposed to arsenic above EPA’s drinking water standard under normal conditions, a number that jumps to 4.1 million during drought, since dry conditions concentrate naturally occurring arsenic in groundwater. A separate USGS groundwater quality study found arsenic at detectable levels in nearly half of the wells sampled in aquifers used for drinking water, with concentrations generally higher in the western US.
Where Does Lead in Tap Water Actually Come From?
Almost never from the source water itself. It comes from the pipe between the water main and your kitchen faucet.
Lead is different from arsenic or chromium-6 because it’s usually not naturally occurring in the water supply, it’s a delivery problem. Water leaves the treatment plant essentially lead-free and picks up contamination on the way to your tap, from lead service lines, old lead solder on copper pipe joints, or brass fixtures that still contain trace lead even in newer construction. The EPA estimates there are still somewhere around 9 million lead service lines in use across the country.
That’s the backdrop for the EPA’s Lead and Copper Rule Improvements, finalized in October 2024. The rule requires most water systems nationwide to replace essentially all lead service lines within ten years, with a hard deadline of November 2037 for full replacement, along with a lower action level and stricter tap sampling requirements. It’s a real fix, but it’s a decade-long infrastructure project, not something that changes what’s in your pipe tomorrow. If your home was built before the mid-1980s, or you don’t know what your service line is made of, that’s the gap between “the rule was passed” and “my water is lead-free,” and it’s a gap that can run into years depending on your utility’s replacement schedule.
Is Low-Level, Chronic Exposure Actually Dangerous, or Just a Regulatory Technicality?
It’s a real health risk, not just a paperwork threshold, even at exposure levels below the levels that trigger an official violation.
A 2018 review of 37 studies covering nearly 350,000 people, highlighted by the American Heart Association and Columbia University’s Mailman School of Public Health, found that higher blood lead and urine arsenic levels were associated with 15 to 85 percent higher risk of stroke and heart disease. Researchers describe the mechanism as chronic, low-grade damage: oxidative stress, inflammation, and arterial wall thickening that builds up over years, not a single dramatic exposure event. That’s a meaningfully different risk profile than most people assume when they hear “trace amounts.”
Children carry a disproportionate share of that risk. Even low blood lead levels are linked to behavioral problems, slowed growth, and reduced IQ, and kids absorb proportionally more of what’s in their food and water relative to body weight than adults do, which is part of why arsenic exposure guidance is especially conservative for younger children.
Where Does Reverse Osmosis Come From, and Why Trust It With Metals?
RO started as heavy industrial technology built to pull dissolved solids and metals out of water at a scale far beyond a household tap, decades before it ever showed up under a kitchen sink.
Reverse osmosis forces water through a semi-permeable membrane fine enough to block dissolved metal ions while letting water molecules through. Industrial plants have leaned on this exact mechanism for years to treat boiler feedwater, wastewater discharge, and process water in facilities where metal contamination isn’t a theoretical risk, it’s a daily operating reality tied to compliance and equipment longevity. AMPAC USA has spent years designing and manufacturing industrial reverse osmosis systems for that world: high-volume plants that need consistent rejection rates on a wide range of contaminants, metals included, running around the clock.
The residential and commercial systems built off that same membrane technology aren’t a stripped-down consumer gimmick, they’re a scaled-down version of the same separation principle, engineered for a single household’s flow rate instead of a factory’s. That’s a real distinction worth drawing, because it’s the difference between filtration that happens to reduce some contaminants and filtration that was engineered from the industrial side to specifically reject dissolved metals.
How Well Does RO Actually Remove These Specific Metals?
Very well, though rejection rates vary a bit by metal and by the system’s condition.
Independent lab data and NSF-certified testing put RO rejection in this range:
– Lead: roughly 95 to 99 percent removal, among the most consistently well-rejected contaminants for RO membranes.
– Arsenic: up to about 97.6 percent removal for the more common oxidation state (As V), though removal is more variable for the other form (As III), which is part of why pre-treatment matters in well water applications.
– Hexavalent chromium (chromium-6): reported removal ranging from 85 to 99.9 percent depending on water chemistry and system setup, with NSF-certified systems commonly clearing 97 percent or more.
Those numbers explain why RO shows up as a go-to recommendation in most water treatment guidance for metals specifically, rather than carbon filtration alone, which is effective against chlorine, taste, and some organics but isn’t built to reject dissolved metal ions the way a membrane is.
What Should Homeowners and Facility Managers Actually Do With This Information?
Start with a real water test, not a guess, then match the treatment to what the test actually shows.
For a home on municipal water, the EWG database is a reasonable first stop to see what’s been reported for your specific utility. For a private well, that database won’t help, wells aren’t tested under the same reporting rules, so an independent lab test is the only way to know what’s actually coming out of your tap. From there, the fix depends on scale: a single point-of-use RO system under the kitchen sink covers drinking and cooking water, a whole-house system addresses water at every fixture, and commercial or light-industrial applications, restaurants, clinics, small manufacturers, need something closer to the volume and consistency of a commercial-grade RO build.
AMPAC USA builds across that full range, from industrial reverse osmosis systems designed for high-volume metal rejection, to commercial reverse osmosis systems for offices, restaurants, and multi-unit buildings, down to residential reverse osmosis systems sized for a single home. The engineering lineage is the same membrane technology across all three, just built for different volumes.
The honest takeaway from all this survey data isn’t that tap water in the US is uniquely dangerous. It’s that “meets the legal limit” and “has zero risk” aren’t the same claim, and for anyone with young kids, an older home, or a private well, that distinction is worth a $30 test kit and, depending on what it shows, a filtration system built to actually remove what’s found.
Frequently Asked Questions
Does boiling tap water remove lead, arsenic, or chromium-6?
No. Boiling kills biological contaminants like bacteria, but it doesn’t remove dissolved metals. Since boiling evaporates water and concentrates whatever’s left behind, it can actually raise the relative concentration of metals in the water that remains.
How do I find out what’s in my specific water supply?
If you’re on a municipal system, check the EWG Tap Water Database or your utility’s annual Consumer Confidence Report, both use EPA-reported testing data. If you’re on a private well, neither applies, wells aren’t covered by these reporting systems, so an independent lab water test is the only reliable option.
Is chromium-6 regulated by the EPA?
The EPA regulates total chromium, but there is currently no federal maximum contaminant level specific to hexavalent chromium (chromium-6), despite its documented cancer risk and detection in water serving over 250 million Americans, according to EWG’s analysis.
Will a standard carbon filter pitcher remove heavy metals?
Basic carbon filtration is effective against chlorine taste and odor and some organic compounds, but it’s not designed to reject dissolved metal ions the way a reverse osmosis membrane is. For lead, arsenic, or chromium-6 specifically, RO is the more reliable technology.
Are older homes automatically at higher risk for lead in tap water?
Not automatically, but risk correlates strongly with age. Homes built before the mid-1980s are more likely to have lead service lines or lead solder on copper pipe joints. The only way to know for certain is testing, since some newer homes still have trace lead in brass fixtures and some older homes have already had their lines replaced.
Sources: Environmental Working Group (Tap Water Database, 2025 update; 2025 chromium-6 co-occurrence map); U.S. Geological Survey (National News Release on arsenic in private wells; national groundwater quality study); U.S. Environmental Protection Agency (Lead and Copper Rule Improvements, Federal Register, October 2024); American Heart Association / Columbia University Mailman School of Public Health (chronic heavy metal exposure and cardiovascular disease); peer-reviewed RO rejection rate studies (PMC/NCBI) on hexavalent chromium and arsenic removal.
AMPAC USA engineers custom water purification systems for commercial, industrial, and emergency applications — from 500 GPD to multi-million GPD. Trusted by municipalities, military, and industry worldwide.