If you’ve ever wondered whether the water quality in your state is actually good — or whether your neighbor’s state has cleaner water than yours — you’re not alone. Water quality varies dramatically across the U.S., driven by local geology, infrastructure age, agricultural activity, and how aggressively each state enforces EPA standards. Here’s what the data actually shows.
How Water Quality Rankings Are Measured
Most state water quality rankings come from EPA Safe Drinking Water Information System (SDWIS) data, which tracks health-based violations (contaminants exceeding maximum contaminant levels), monitoring violations (utilities that don’t test properly), and the percentage of the population served by compliant systems.
It’s worth noting what these rankings don’t capture: private well water (43 million Americans, no federal oversight), emerging contaminants not yet regulated (certain PFAS compounds, microplastics), and water that’s technically compliant but still has quality issues that affect taste, odor, or long-term health.
States With the Best Drinking Water Quality
Based on EPA violation rates and compliance data:
Hawaii consistently ranks first or near-first for drinking water quality among U.S. states. The islands benefit from volcanic rock aquifers that naturally filter groundwater and a relatively young, well-maintained infrastructure. Hawaiian water systems have among the lowest health-based violation rates in the country.
South Dakota and Vermont regularly appear near the top of state water quality rankings. Both states have lower population density (reducing demand on treatment infrastructure), strong state-level oversight programs, and less industrial pollution than heavily industrialized states.
Connecticut, Rhode Island, and Massachusetts — despite having older infrastructure — invest heavily in treatment technology and have relatively stringent state-level standards that go beyond federal minimums.
States With Notable Water Quality Challenges
The reverse of the above picture reveals states where water quality concerns are more prevalent:
Texas had over 1,000 health-based violations in a recent review period — partly attributable to its large number of small, rural water systems with limited resources for compliance. Urban water supplies in Houston, Dallas, and Austin are generally high quality; the challenges concentrate in smaller rural systems.
Florida faces challenges from high dissolved solids in groundwater sources, algal bloom contamination in surface water, and in some areas, high naturally-occurring arsenic and radon. The state’s large population served by diverse water sources creates significant variability.
California has among the most complex water quality landscapes of any state: Bay Area tap water ranks among the best in the country, while agricultural areas in the Central Valley have documented nitrate, arsenic, and pesticide contamination in both groundwater and some small system municipal supplies.
The PFAS Complication
State rankings based on historical compliance data are increasingly incomplete because PFAS contamination is now a nationwide concern that cuts across state lines and affects even high-ranking states.
In April 2024, the EPA finalized the first-ever national PFAS MCLs, setting limits of 4 parts per trillion for PFOA and PFOS. EWG analysis found that 158 million Americans across all 50 states may be exposed to PFAS in tap water. States with significant military bases, manufacturing history, or airport proximity face higher PFAS risks regardless of their overall compliance rankings.
No state is PFAS-free. This is the most important caveat when reading any water quality ranking from before 2024.
What State Rankings Don’t Tell You About Your Water
Even in the top-ranked states, individual utility performance varies enormously. A state might rank third nationally while having pockets of infrastructure failure in specific municipalities. Your neighborhood’s water depends on:
- Your water system’s infrastructure age — service lines installed before 1986 may contain lead
- Source water type — groundwater vs. surface water sources have different contamination profiles
- Your home’s plumbing — even clean municipal water can pick up lead from household pipes and fixtures
- Local agriculture — nitrate and pesticide runoff follows watershed boundaries, not state lines
Testing Your Own Water: The Only Way to Know for Certain
State rankings give you a starting point, not an answer. The EPA recommends all households test their water annually, especially for:
- Lead (especially pre-1986 homes)
- Nitrates (if near agricultural areas or with an infant at home)
- Coliform bacteria (especially for well water)
- PFAS (if near known contamination sources)
Many state health departments offer free or low-cost water testing. The EPA’s Safe Drinking Water Hotline (800-426-4791) can connect you with certified testing labs in your area.
When Your Water Ranks Well but You’re Still Concerned
Even if you live in Hawaii, Vermont, or Connecticut — states that consistently rank among the best — there are valid reasons to consider home filtration:
- Pre-1986 plumbing in your home could be introducing lead at the tap even from clean source water
- PFAS contamination is present in some degree across all states
- Taste and odor from chlorination treatment affects water quality even when it’s technically safe
- Medical conditions or compromised immunity may call for higher-standard filtration
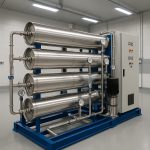
No matter which state you’re in, AMPAC USA’s reverse osmosis water filtration systems remove 99%+ of lead, PFAS, nitrates, and hundreds of other contaminants — giving you the highest level of in-home water protection available.
AMPAC USA engineers custom water purification systems for commercial, industrial, and emergency applications — from 500 GPD to multi-million GPD. Trusted by municipalities, military, and industry worldwide.